
As of June 25, 2026, the most dangerous mistake in oil-market analysis is to treat a price pullback as proof that the supply chain has healed. The issue is not only the oil price. It is whether crude can move from the production region to refineries while inventory buffers keep shrinking.
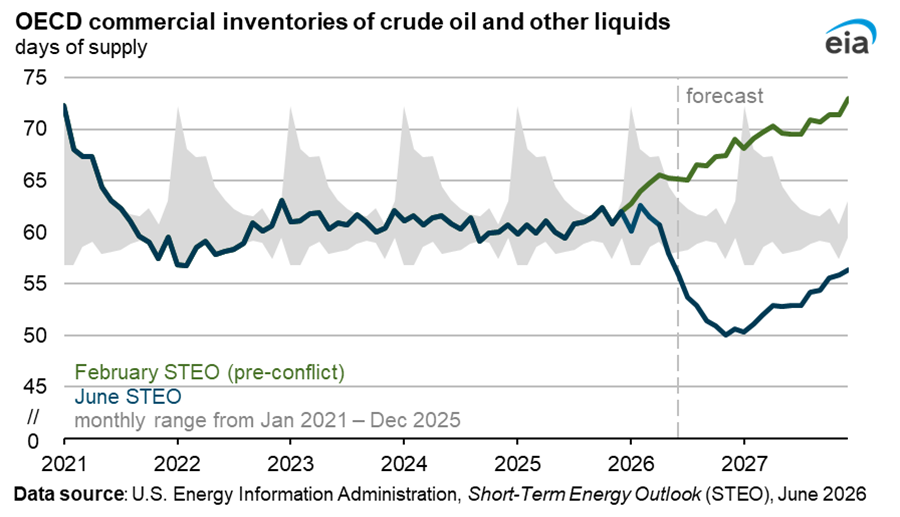
The short answer: global oil exports have not completely stopped, and it would be wrong to write the story that way. But the shock from the Strait of Hormuz and Gulf logistics has not fully disappeared either. EIA, API, IEA, and JODI data all point to the same uncomfortable message: inventories and logistics deserve more attention than one daily price move.
✨ Key Takeaway
| Checkpoint | How to read it as of June 25, 2026 |
|---|---|
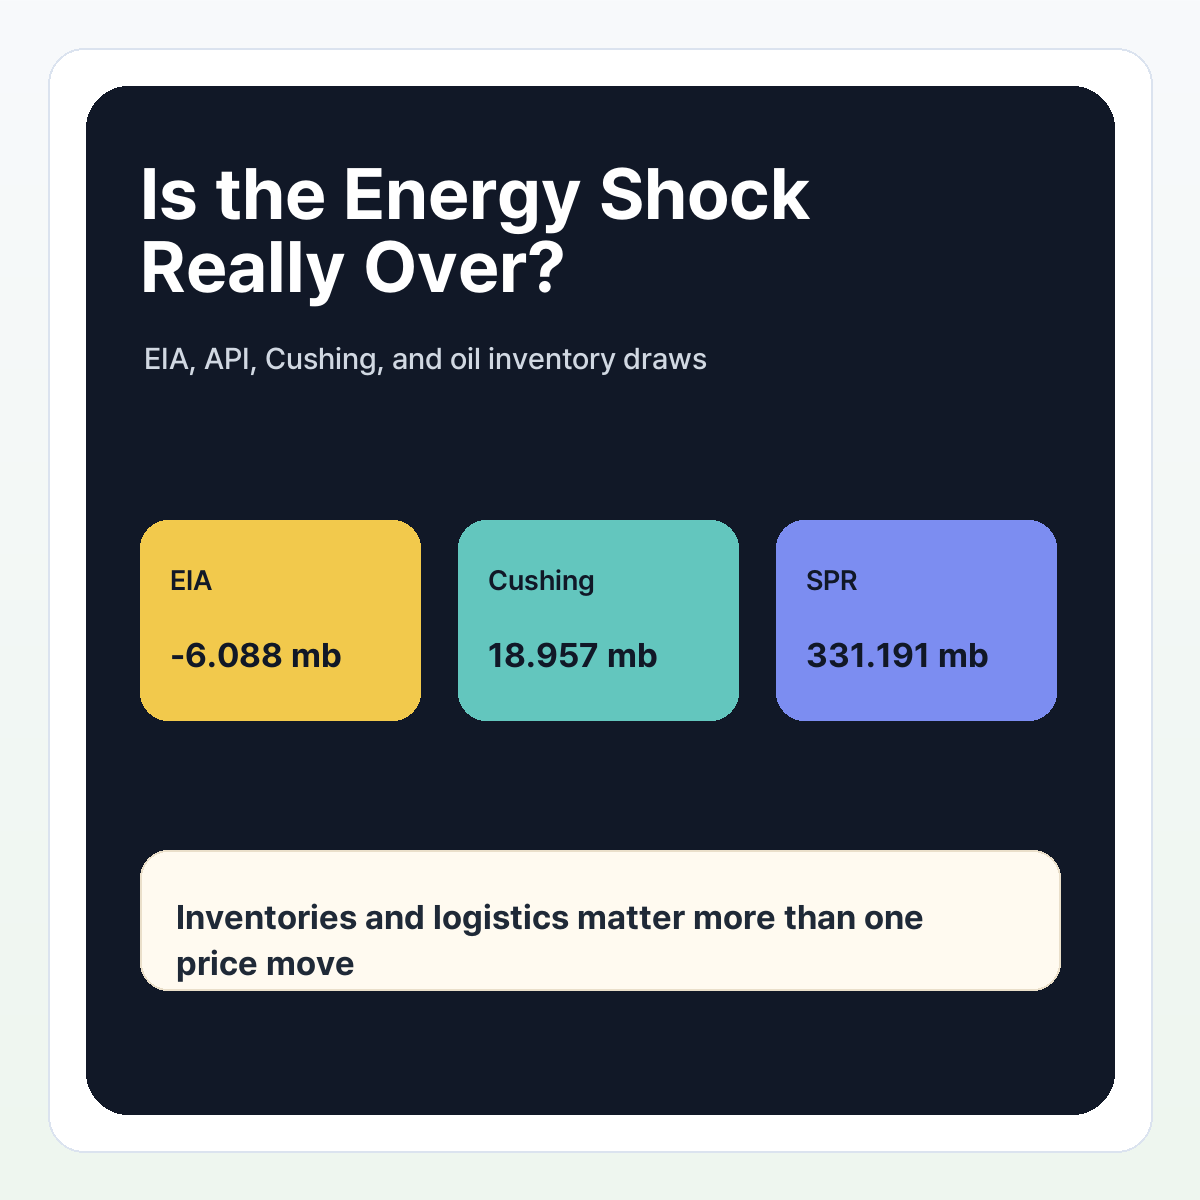
| EIA release | Commercial crude stocks fell 6.088 mb in the week ending June 19, to 412.134 mb |
| API release | Private estimate showed a smaller 0.765 mb crude draw after an 8.33 mb draw the prior week |
| Cushing | 18.957 mb remaining; below 20 mb is a market-watched operating-risk zone |
| SPR | 331.191 mb remaining; the pace of releases matters more than a simple ’empty or not’ framing |
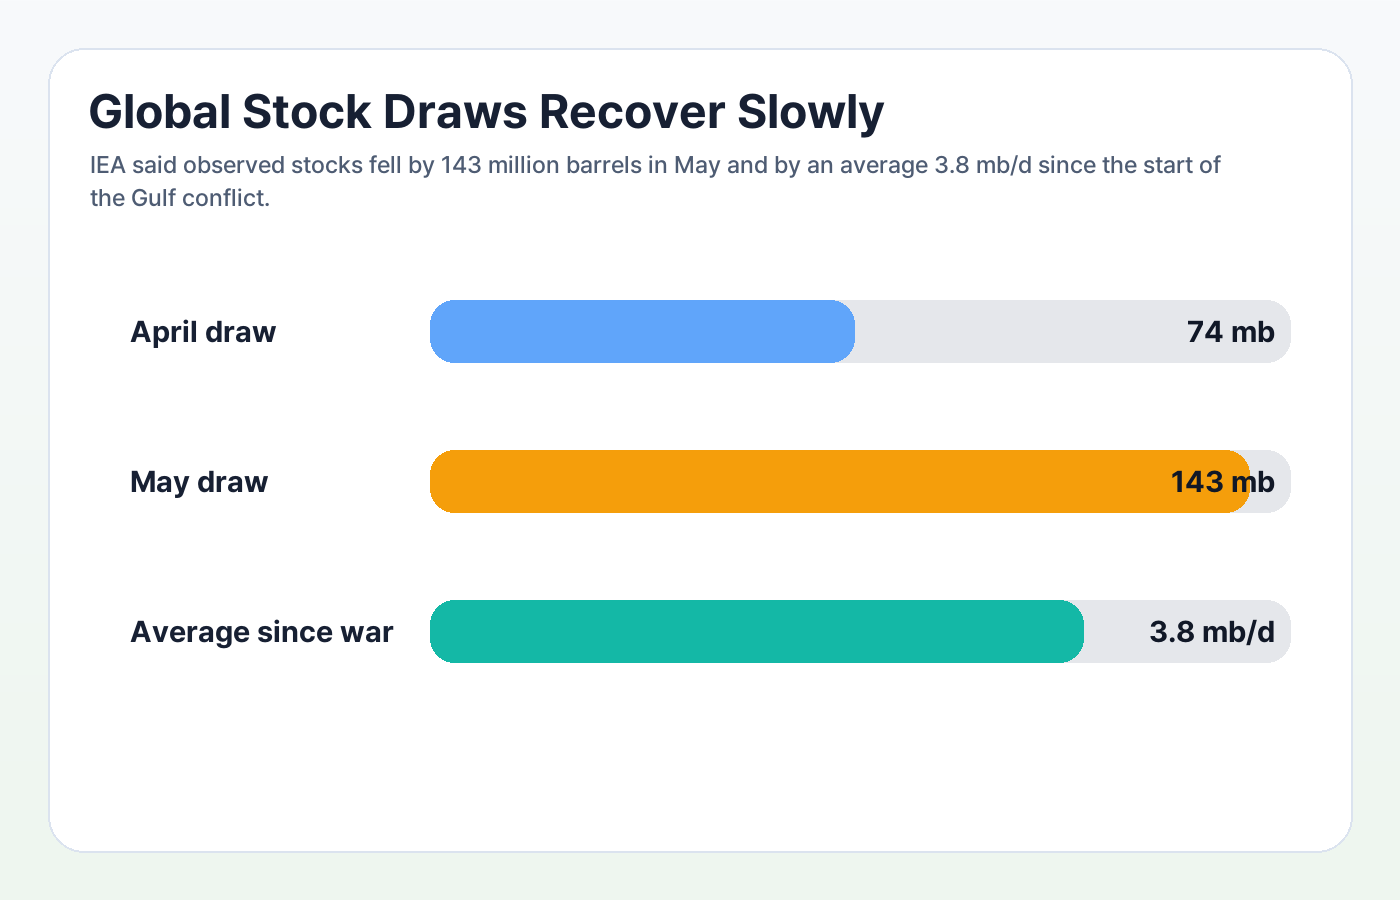
| Global stocks | IEA said observed stocks fell by 143 mb in May |
| Korea angle | FX, refining margins, diesel, jet fuel, power bills, and import prices matter together |

How Should We Read the Latest EIA and API Releases?
EIA’s Weekly Petroleum Status Report was released on June 24, 2026 for the week ending June 19. The official summary says U.S. commercial crude inventories decreased by about 6.1 million barrels to roughly 412.1 million barrels, around 7% below the five-year average. Source: EIA WPSR
API’s private weekly estimate showed a 765,000-barrel crude draw for the same reference week. API and EIA numbers do not have to match because they are different weekly estimates and market users often treat API as an early signal and EIA as the official confirmation. Source: Trading Economics API crude oil stock change
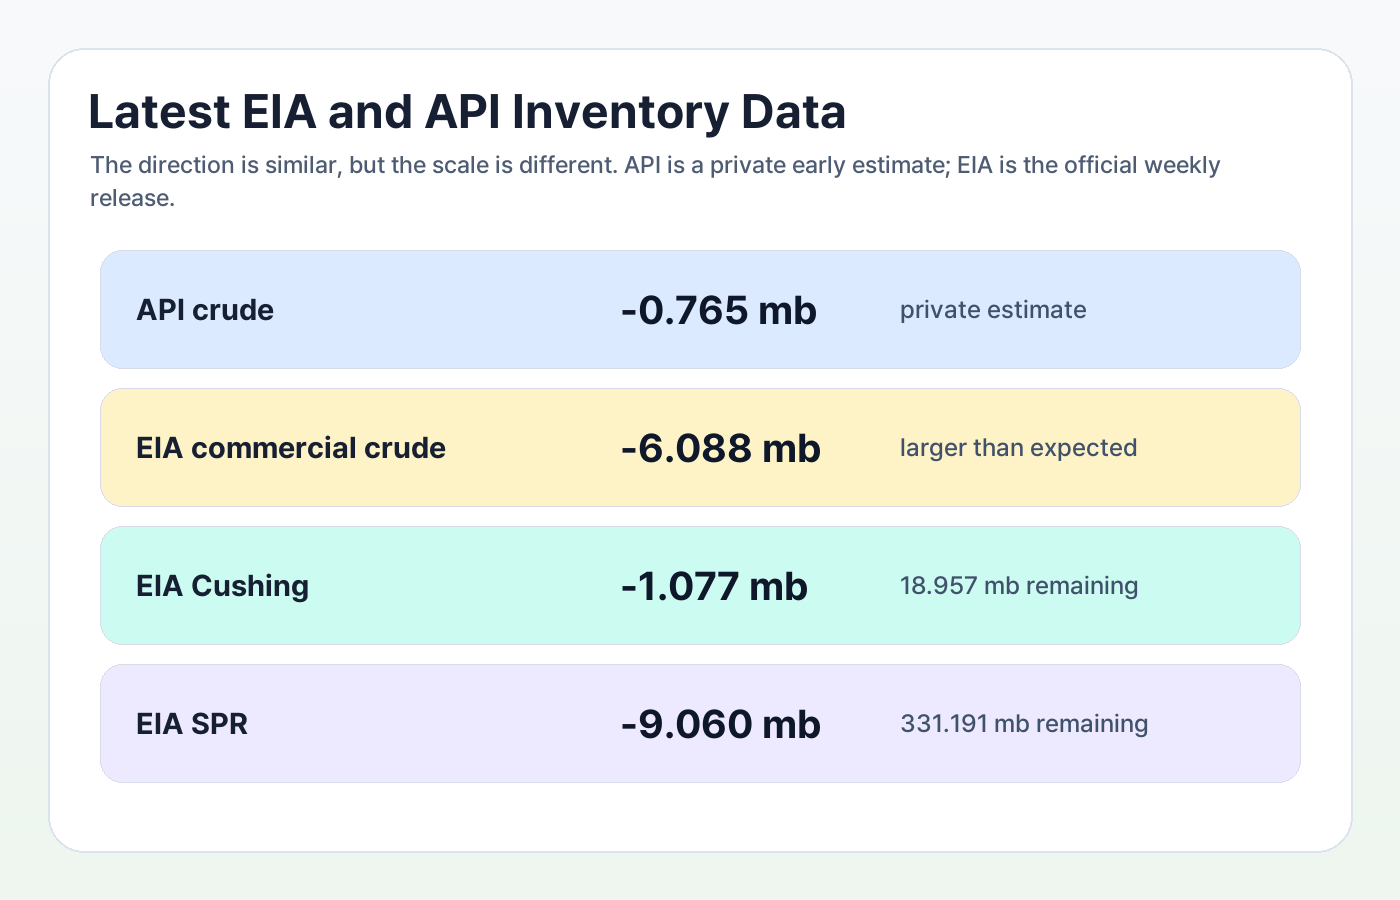
| Release | Reference week | Crude stock change | What else to watch |
|---|---|---|---|
| API | Week ending 2026-06-19 | -0.765 mb | Cushing -0.982 mb, SPR around 331.2 mb |
| EIA commercial crude | Week ending 2026-06-19 | -6.088 mb | Larger draw than expected |
| EIA Cushing | Week ending 2026-06-19 | -1.077 mb | 18.957 mb remaining |
| EIA SPR | Week ending 2026-06-19 | -9.060 mb | 331.191 mb remaining |
If Hormuz Reopens, Is the Shock Over?
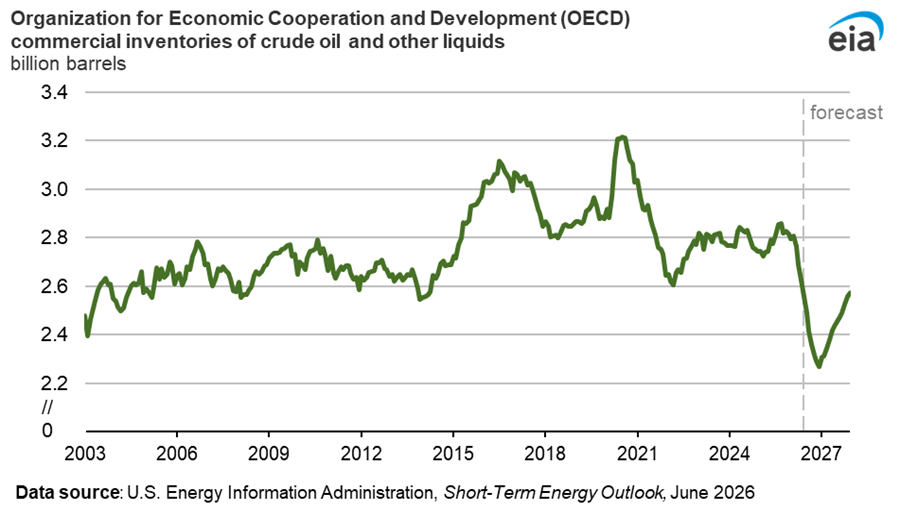
The IEA June Oil Market Report said Gulf flows recovered from their May lows, but a full recovery would not be immediate. Shipping lanes, insurance, port operations, mine clearance, vessel repositioning, and refinery feedstock matching all take time. Source: IEA Oil Market Report June 2026
Oil production does not help consumers unless crude and refined products can move through the system. The key chokepoint is not only the wellhead; it is the route from export terminal to refinery to final product market.
Where Can Country-Level Inventory Draws Be Checked?
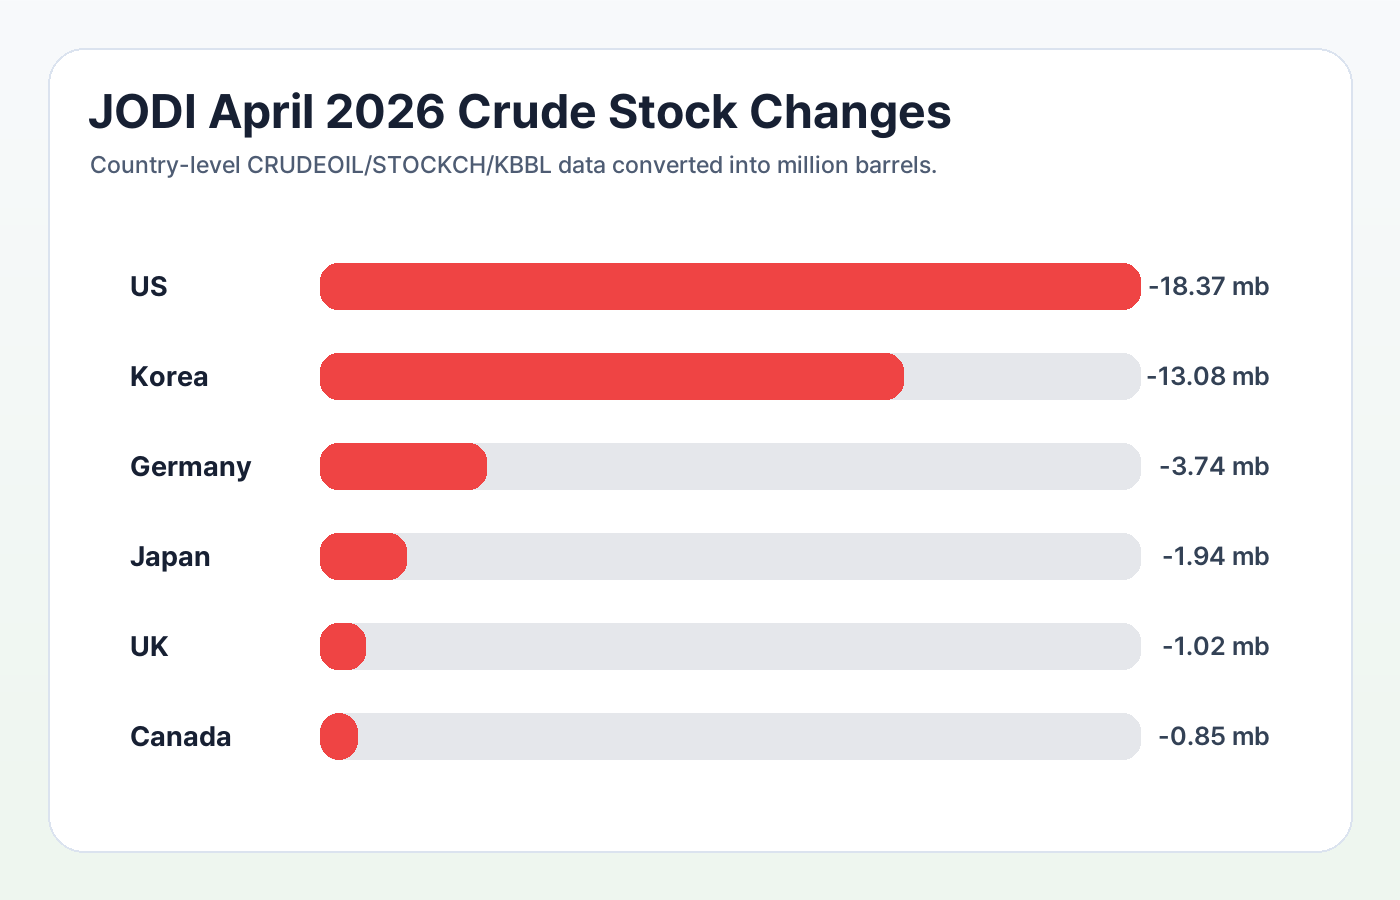
Country-level crude stock changes can be checked through JODI monthly data. JODI provides oil product and flow data for more than 90 participating economies and offers annual CSV downloads. CRUDEOIL / STOCKCH / KBBL was converted into million barrels. Source: JODI data downloads
| Country | April 2026 crude stock change | Interpretation |
|---|---|---|
| United States | -18.37 mb | Commercial stocks and strategic releases both matter |
| South Korea | -13.08 mb | Import dependence makes inventories and FX important together |
| Germany | -3.74 mb | European product and refining flows need monitoring |
| Japan | -1.94 mb | Northeast Asian importing country pressure |
| United Kingdom | -1.02 mb | Product-market and shipping sensitivity |
| Canada | -0.85 mb | A useful North American balance reference |
Why Does Cushing at 18.957 Million Barrels Matter?
Cushing, Oklahoma is the WTI delivery hub and an important part of U.S. crude logistics. When inventories fall too low, the issue is not just a price chart. Tank operations, pipeline pressure, pump suction, refinery scheduling, and crude quality all become more sensitive.
Still, it would be wrong to call the 20 million-barrel level an official deadstock threshold. EIA has not declared Cushing deadstock. A better phrase is that inventories have moved below a market-watched operating-risk level.
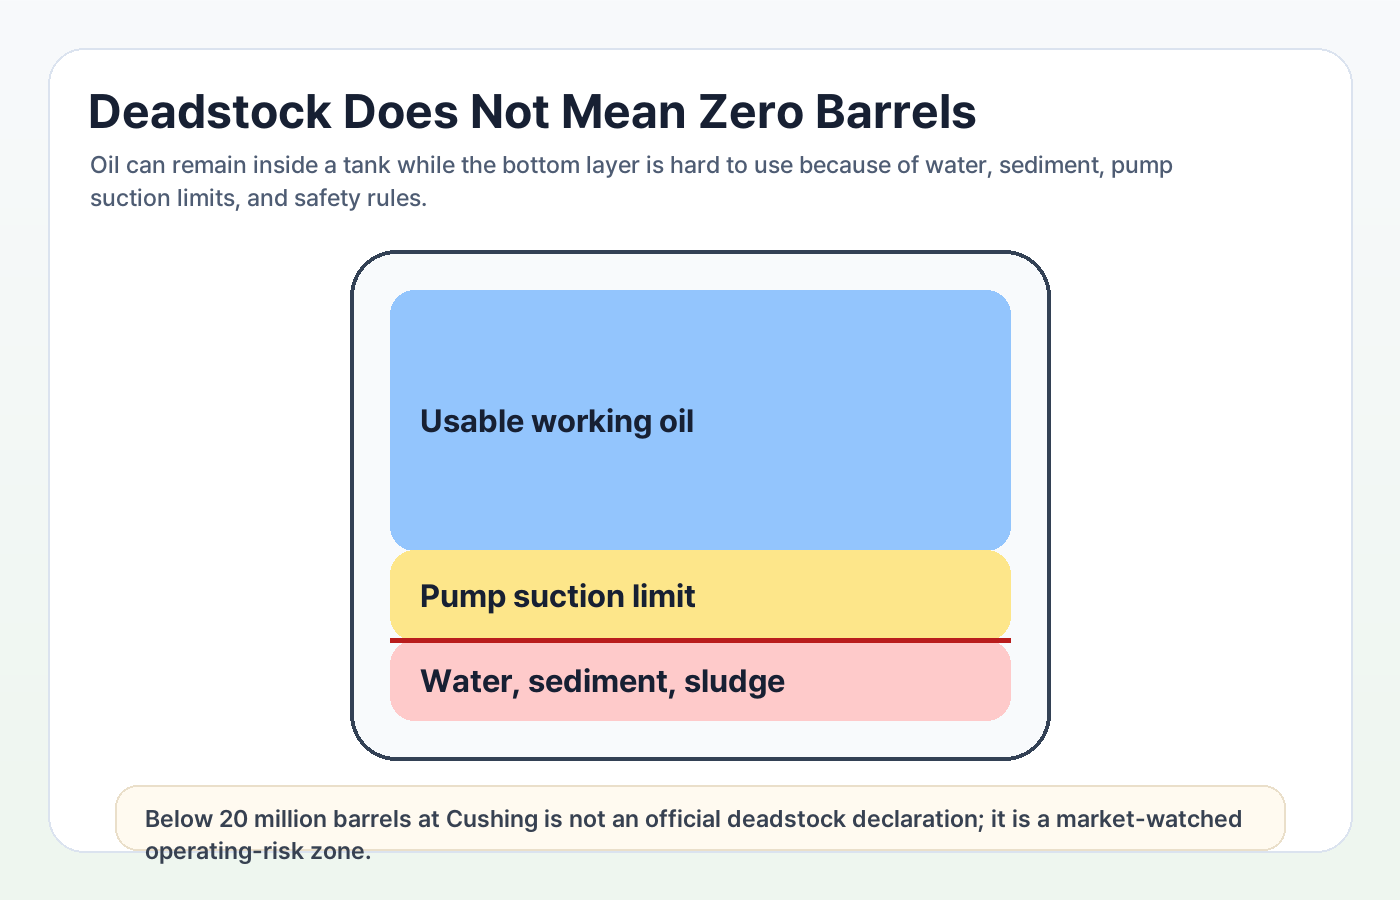
A crude tank is not a clean bottle that can be emptied to the last drop. Water, sediment, and sludge can sit at the bottom, and pump intake points are not always at the absolute bottom. At very low levels, quality, safety, and pressure constraints can make some remaining barrels difficult to use as normal working inventory.

Why Can U.S. Stocks Fall If the U.S. Produces So Much Oil?
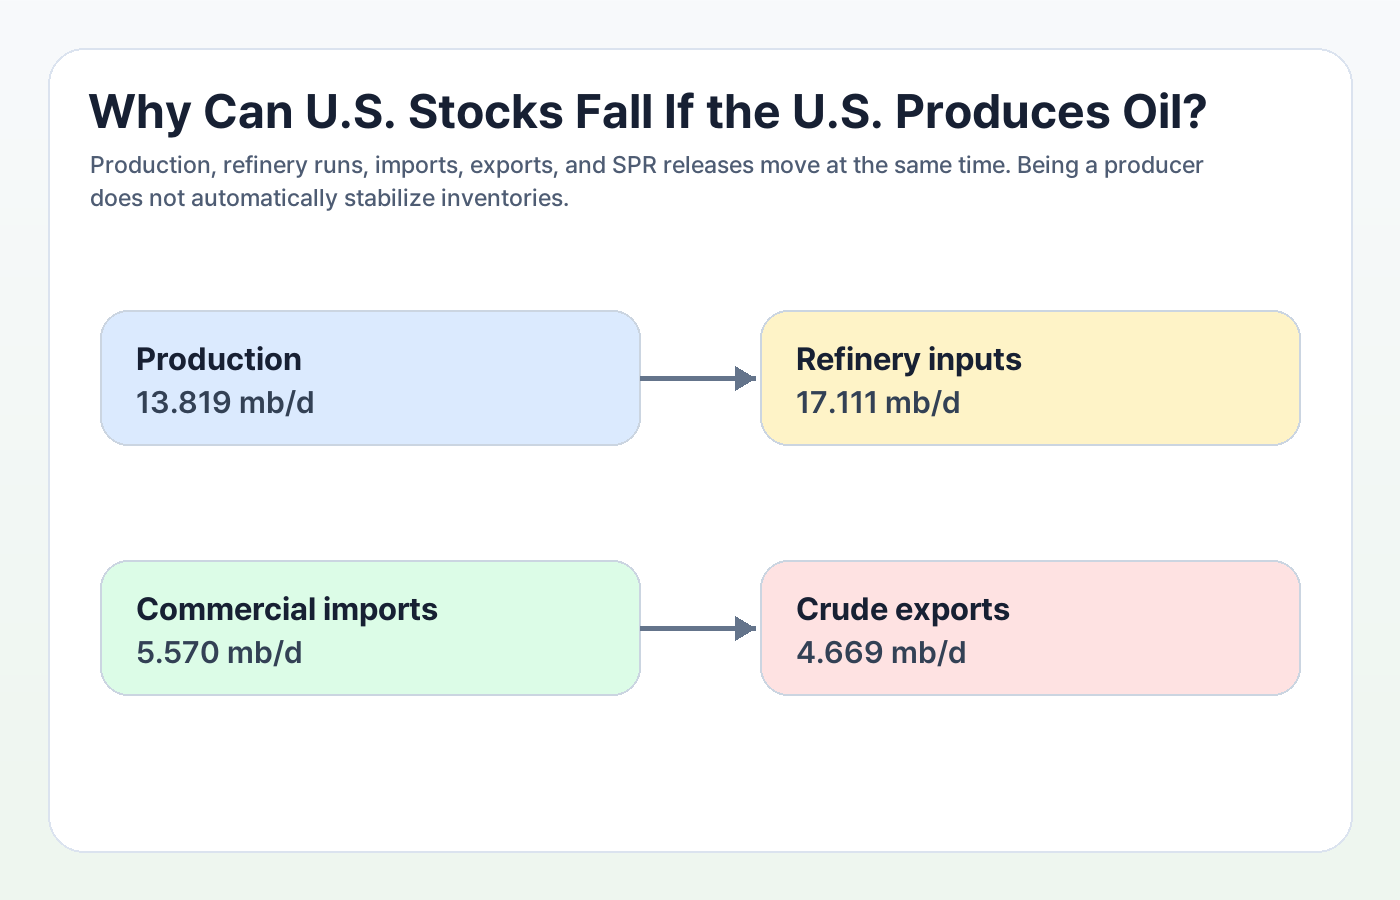
The United States is a major oil producer, but that does not automatically keep inventories stable. For the week ending June 19, EIA data showed U.S. crude production at 13.819 mb/d and refinery crude inputs at 17.111 mb/d. Refiners were processing more crude than domestic production alone could cover.
Crude quality and logistics also matter. Some U.S. crude is better suited for export markets, while some refineries are configured for specific crude slates. So ‘there is oil in the country’ is not the same as ‘the right refinery has the right crude at the right time.’
EIA’s March 2024 storage capacity report includes a line item called ‘Pipeline Fill and in Transit by Water and Rail.’ At about 135.7 million barrels, it is better understood as operating inventory needed to keep the system moving, not as a simple emergency stockpile ready to be drained. Source: EIA storage capacity report
Why Worry About the SPR If More Than 300 Million Barrels Remain?
The U.S. Department of Energy describes the SPR as federally managed crude oil stored in salt caverns across four Gulf Coast sites. DOE’s quick facts list a maximum nominal drawdown capability of 4.4 mb/d and about 13 days for oil to enter the market after a presidential decision. Source: DOE SPR Quick Facts
So yes, 331.191 million barrels is still a large number. The concern is the rate of use. SPR releases can calm the market today, but they also reduce the cushion for the next shock. That is not an exhaustion claim; it is a policy-buffer claim.
How Could This Reach Korean Households and Companies?
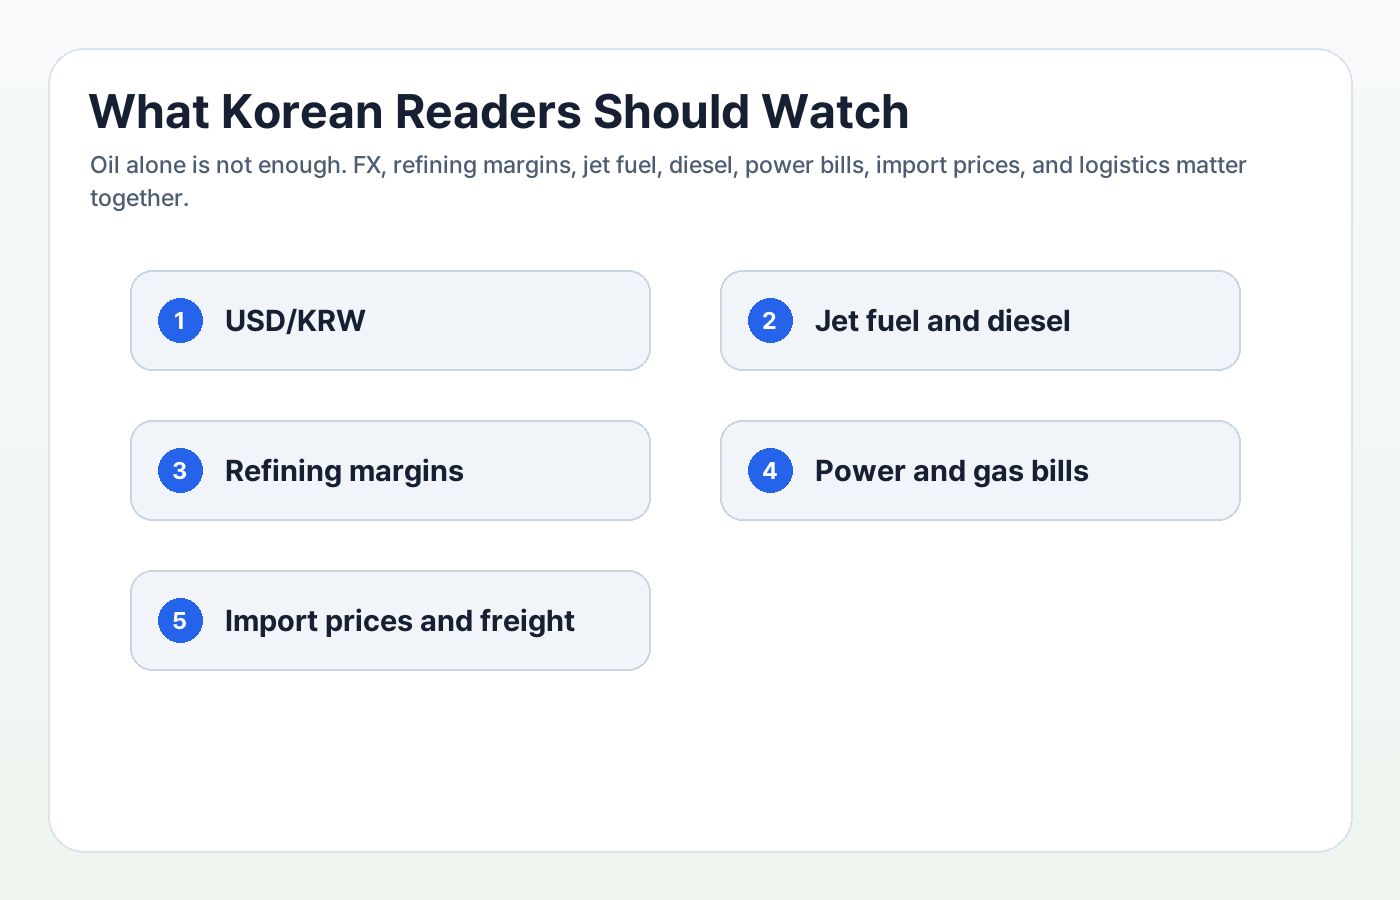
For Korean readers, WTI alone is not enough. Korea is highly exposed to imported energy, so USD/KRW, refining margins, diesel, jet fuel, LPG, electricity and gas bills, freight costs, and import prices all need to be watched together.
Even if crude prices fall quickly, refined products may not normalize at the same speed. Jet fuel hits airlines and logistics, diesel affects freight and construction, and LPG or electricity costs affect household and small-business budgets. Energy shocks often appear late in consumer prices and corporate costs.
Possible Scenarios From Here
| Scenario | Signal to watch | Interpretation |
|---|---|---|
| Easing | Stable Hormuz traffic, Gulf exports recover, insurance costs fall | Oil may stabilize, but inventory rebuilding still takes time |
| Uneasy range | Prices fall while Cushing, SPR, and product stocks stay tight | Paper-market relief and physical-market stress coexist |
| Renewed shock | Hormuz tension returns, Cushing falls further, products tighten | Diesel, jet fuel, LPG, and import prices become sensitive again |
The current data do not support a simple ‘oil must surge’ call. Prices can fall quickly on news and diplomacy. But inventories and logistics recover more slowly than price screens. That is why Cushing, SPR, refined-product stocks, Gulf exports, and Asian import data matter more than one headline.

FAQ
Why are EIA and API numbers different?
API is a private weekly estimate, while EIA is the official government weekly statistical release. They can differ in scale even when the direction is similar. This week, both pointed to a crude draw, but EIA’s draw was much larger.
Does Cushing below 20 million barrels mean official deadstock?
No. The 20 million-barrel area is a market-watched operating-risk zone, not an official EIA deadstock declaration. Actual deadstock depends on facility design, crude quality, pump location, and operating rules.
Why worry about SPR if more than 300 million barrels remain?
Because the pace of drawdown affects future policy flexibility. The SPR is still large, but repeated releases reduce the cushion available for the next supply shock.
If Hormuz reopens, do inventory draws stop immediately?
Not necessarily. Ships, insurance, ports, refinery feedstock matching, and supply-chain scheduling take time. Prices can react fast; physical logistics usually heal more slowly.
What should Korean readers watch first?
Watch USD/KRW, Korean refining margins, diesel and jet fuel prices, Korean inventory data, import prices, and power or gas tariff signals alongside WTI and Brent.
Public Sources
- EIA Weekly Petroleum Status Report
- EIA WPSR summary PDF
- Trading Economics – EIA crude oil stocks
- Trading Economics – API crude oil stock change
- API Weekly Statistical Bulletin
- IEA Oil Market Report June 2026
- JODI Oil Data Downloads
- EIA Working and Net Available Shell Storage Capacity
- DOE SPR Quick Facts
Informational energy-market commentary based on public data. This is not a recommendation to buy or sell any commodity, stock, or ETF.